What your glider’s polar really tells you — and what it doesn’t.
Ask any glider pilot what their aircraft’s polar curve looks like, and most will proudly point to the sleek downward swoop ending somewhere around a 40:1 glide ratio. But the truth is, the polar isn’t just a manufacturer’s brag sheet — it’s a living, breathing portrait of how your glider trades energy for distance. Understanding it deeply changes how you fly, how you ballast, and even how you think about weather and task speed.
At OhMyGlider, we like to say: “Once you can read the polar, you can read the sky.”
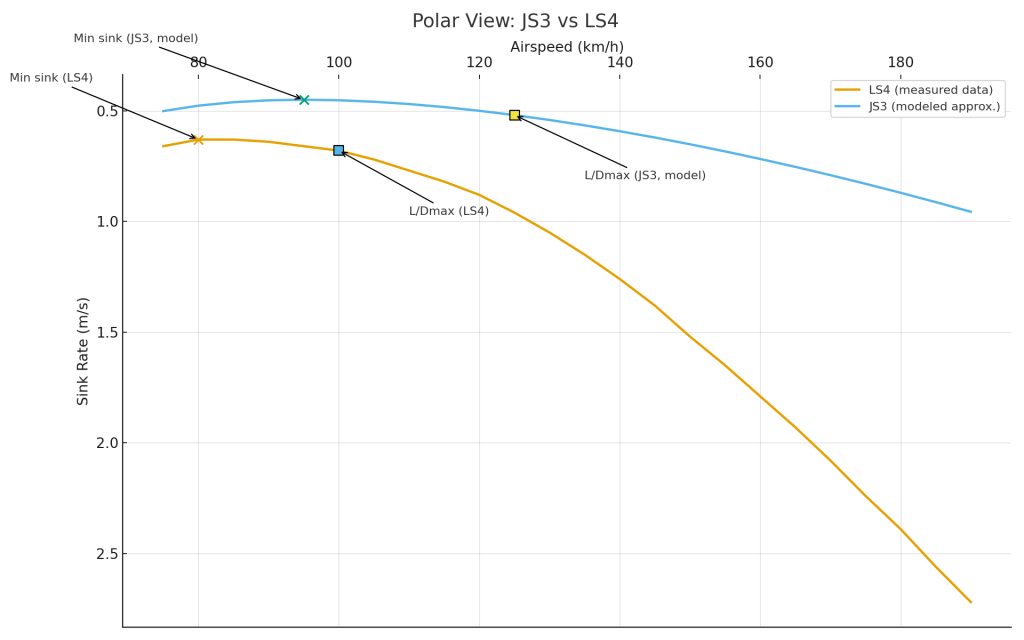
A glider’s polar curve plots sink rate (vertical axis) against airspeed (horizontal axis).
Every point along that line is a snapshot of how much altitude you lose while flying at a given speed in still air. The lower the curve, the better the performance — meaning you can fly faster with less sink. However, the polar is more than a static graph. It encodes three fundamental truths:
For instance, the LS4 has its best L/D (~40:1) at around 90 km/h, whereas a JS3 reaches ~55:1 at 110 km/h. That difference defines not just speed — but how aggressively each glider can “cut through” airmass variations.
The glossy brochure polar is a dream world:
In real life, your polar is a moving target. Add a few dead bugs, a slightly imperfect seal, or 50 litres of water ballast — and your curve shifts upward and sideways.
Example:
An LS8-18 at 500 kg will achieve around 44:1, but at 600 kg with ballast, its minimum sink worsens while the optimum speed moves up by roughly 10–15 km/h. That’s not a flaw — that’s physics. Heavier aircraft penetrate better, climb worse, and reward you with higher cruise speeds between thermals.
The key lesson: every change you make in the cockpit moves your polar.
A polar curve on paper means nothing until it meets the atmosphere. Thermals, wind, and convection distort the “perfect still-air world” that the polar assumes. So your job as a pilot is to mentally deform that curve to fit real conditions.
When thermals are booming (say +4 m/s average), flying at the best L/D speed is a mistake. You’re wasting time floating around too slowly between thermals. This is where MacCready theory comes in — tilting the tangent line upward to represent expected climb rate. The steeper the tangent, the faster the optimum cruise.
For example:
In weak, blue conditions (+1.5 m/s or less), your polar discipline matters more than ever. Even a 0.2 m/s misjudgment in average sink can mean losing 100 meters over a 10 km glide. That’s the difference between arriving above or below final glide height.
Pro tip: Always “fly the average” — not the spike. Watch your vario trend, not the instantaneous peaks.
Let’s say you’re in your LS4 at 95 km/h, cruising toward the next cumulus. You know from your polar that your still-air sink rate is ~0.6 m/s. But your vario shows −1.2 m/s — that means you’re in slightly sinking air (~0.6 m/s of it). If your MacCready is set to 1.5, your optimal speed might now be 110 km/h.
The beauty of the polar is that it makes this adjustment predictable — not guesswork.
A subtle yet crucial concept: total energy height (TEH). Your polar curve doesn’t just represent airspeed vs. sink, but how potential and kinetic energy exchange. If you pull up slightly, you’re trading speed for altitude; if you push down, the opposite. That movement along the curve is what the variometer measures — a combination of your sink and pitch energy. When you learn to feel those transitions, you stop chasing the needle and start flying the curve.
Adding ballast increases wing loading, which reshapes the polar curve:
Imagine overlaying two curves — one for an unballasted LS8, one for a full JS3 with 180 l ballast. The JS3’s curve will sit higher but extend further to the right — a high-speed specialist. This is why experienced pilots don’t ask “Should I ballast?” They ask, “Is today fast enough to justify it?”
A good rule of thumb:
In competitions, JS3 pilots often ballast fully even in moderate conditions — because their polar’s slope remains favourable at high MacCready values.
You don’t need the full factory sheet memorized — just the key benchmarks:
Stick a small chart on your panel, or use your LXNAV or Oudie to auto-display the MacCready line on-screen.
Use your own flight data to verify how your glider performs.
You’ll be surprised how much your real-world polar differs — especially if your seals or pitot calibration aren’t perfect.
Even a thin film of insect residue on the leading edge can raise sink by 0.1–0.2 m/s. That’s huge at 100 km/h. Keep your wings clean, and your polar will thank you.
Pilots rarely underperform because their glider is bad — they underperform because they misread what the glider is trying to tell them. Every polar point reflects a decision about risk, time, and lift expectations.
Your polar teaches you emotional discipline: to trust physics over feeling.
Let’s make the polar personal.
| Glider | Class | Best Glide | Speed (L/Dmax) | Typical Cruise (MC=2) | Notes |
|---|---|---|---|---|---|
| LS4 | Club Class | ~40:1 | 90 km/h | ~115 km/h | forgiving, gentle, great in weak lift |
| LS8-18 | Standard/18m | ~44:1 | 100 km/h | ~130 km/h | adaptable, good balance of climb vs. cruise |
| JS3 | 18m/Open | ~55:1 | 110 km/h | ~150 km/h | world-class performer, heavy ballast capacity |
This table tells a story. The JS3 may be king at high speeds, but in a soft blue-thermal day, an LS4 pilot can still outperform it by climbing tighter and lighter. Reading the polar helps you fly your glider on its terms — not someone else’s.
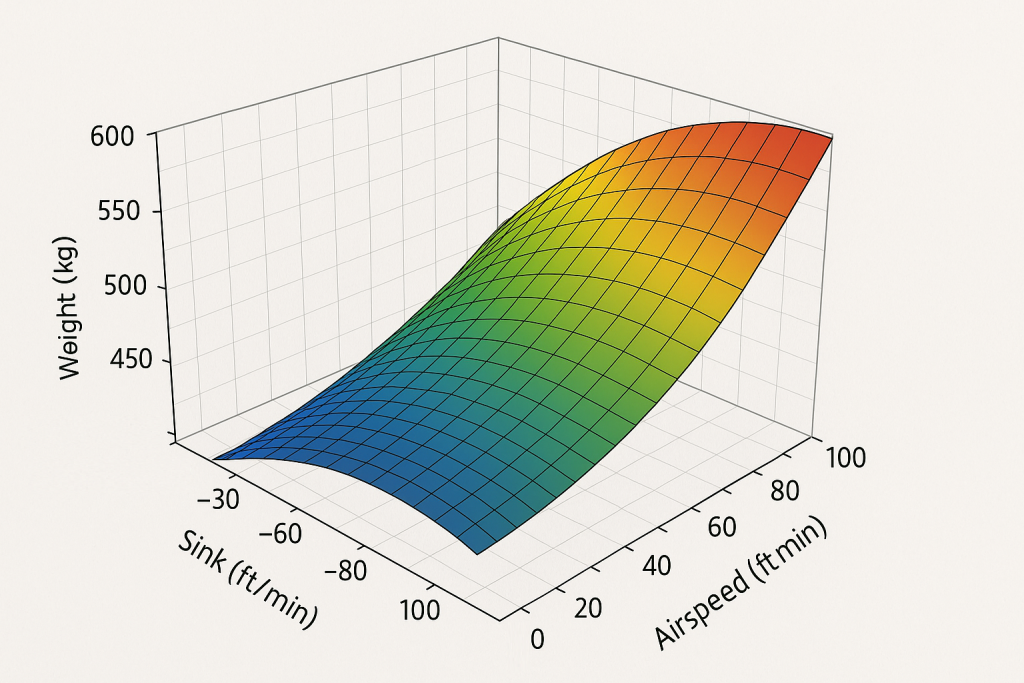
Most pilots think of the polar as a flat 2D chart. But in reality, it’s a 3D surface — with the third axis being weight or wing loading. As you add ballast, the whole surface twists upward and rightward. Modern flight computers (like LX9000 or Naviter Oudie N) can show this dynamically, adjusting your MacCready line in real time as your weight changes due to ballast dump or fuel burn (in self-launchers). Understanding this three-dimensional aspect is the next level of mastery — you start predicting how your aircraft will evolve through the flight.
To “read the polar like a pro” means:
Once you internalize these principles, the polar stops being a graph — and becomes a sixth sense. You’ll start to feel when you’re below the line, when the air isn’t supporting your expectations, and when it’s time to speed up or slow down. That’s when you’ve truly learned to read the polar.
The beauty of gliding is that no instrument can fully replace intuition — but the polar curve comes closest. It’s the quiet mentor in your cockpit, whispering through the variometer needle: “You know what the air is doing. Now act accordingly.”
So next time you’re between thermals, take a moment to think of that elegant curve —
and remember, it’s not just about numbers. It’s about reading the sky through your wings.
